How I Built a Live Content Marketing Dashboard as a Non-Developer
Role: Head of Content Marketing, Waymark
Tools: Claude (Anthropic), Python and Streamlit, React and Next.js, Vercel, HubSpot API, GitHub
Timeline: May - June 2026
Output: A private, live internal dashboard that pulls content marketing performance from HubSpot, Google Analytics 4, and LinkedIn into one branded view
The Problem
Every month, reporting on content marketing performance required the same manual routine. I logged into HubSpot to pull newsletter metrics, into Google Analytics to check website performance, and into LinkedIn to gather company page analytics. Then I assembled the numbers into a document, added context, and sent it to leadership.
The data was useful. The process around it was slow, repetitive, and easy to de-prioritize during busy seasons.
I wanted to replace that routine with a single live dashboard: one private, branded view that leadership and our business development team could open any time to see how content was performing across all three channels, in plain language, without waiting for a monthly summary. I am the first dedicated content marketing hire at Waymark, a healthcare technology company focused on Medicaid, and I am not a developer. This was my first technical build of this kind. I scoped it, chose the tools with Claude's input, built it, and worked through every wall it put in front of me.
The Process
Scoping for a non-technical audience
Before any code, I defined who the dashboard was for and what it needed to do. The audience was executive leadership and the BD team, none of whom needed to see raw analytics. They needed scannable numbers, clear period-over-period movement, and enough benchmark context to know whether a given number was good. That gave me a sense of what the outcome needed to be: A dashboard with a clean layout, plain-language labels, metric cards that showed change over time at a glance, and small context boxes that explained how our numbers compared to industry benchmarks. The goal was a dashboard a busy executive could read in thirty seconds with enough context to understand what they’re looking at.
Phase one: HubSpot and Streamlit
I chose Python and Streamlit for the first build, hosted for free on Streamlit Community Cloud and backed by a private GitHub repository. Streamlit let me stand up a working data app quickly without front-end experience, which made it a sensible starting point for a first build. The HubSpot integration was where I learned that API documentation and API reality do not always match. I connected to HubSpot using a Service Key, the current authentication method, in place of the legacy private app approach.
The first real obstacle came when the email metrics I expected were missing. HubSpot's v3 Marketing Email API was supposed to return performance stats inline, but for our account it returned the emails without their stats. After live diagnostic testing with Claude to confirm what the account was actually sending back, I routed the stats through HubSpot's older v1 campaigns endpoint instead, which did carry the numbers I needed.
A few smaller issues popped up soon after. The email data included entries with missing status values that broke my filtering logic, so I patched the code to handle those empty values cleanly. I also filtered out automation emails with zero deliveries, which were CRM system messages and would have muddied the reporting. Each fix came from testing against live data, seeing what broke, and correcting it. I deployed the result to Streamlit Community Cloud, where it ran as a live, private dashboard.
Hitting the LinkedIn wall
LinkedIn was the first hard limit I struggled to engineer around. Pulling company page analytics through LinkedIn's API requires verifying a developer app against the company page, and that verification requires Super Admin access. My permissions were set to Content Admin, which is not enough, and raising them would have meant pulling in my manager for something I wanted to handle independently. So I made a judgment call. To keep the project from stalling on one channel's permissions, I built a manual monthly input form for LinkedIn metrics as a working fallback. It kept LinkedIn in the dashboard, kept the project moving, and left the door open to a live connection later if the access question was worth revisiting.
Hitting the GA4 wall, and deciding to pivot
A live GA4 connection requires a Google Cloud service account with Viewer access to the analytics property. I created the Cloud project, enabled the Analytics Data API, and created the service account. When I tried to grant it access inside GA4, the interface rejected the service account email. The standard workaround, granting access through the Analytics Admin API in Cloud Shell, was blocked by Waymark's organizational security policies, which is exactly the kind of guardrail you want at a healthcare company holding sensitive data. I could have escalated to IT. I decided not to. A live GA4 connection was not worth the security review and internal coordination it would have required at that stage, especially when I could capture the same numbers another way. That decision pushed me to rethink the whole build.
The pivot: rebuilding on React and Vercel
Instead of continuing to patch the Streamlit version, I rebuilt the dashboard as a React and Next.js application hosted on Vercel. The rebuild solved several problems at once. Streamlit's free tier puts an app to sleep when it sits idle, so the first visitor after a quiet stretch has to wait for it to wake up, which is a poor experience for an executive opening a link. However, a Vercel-hosted app stays responsive.
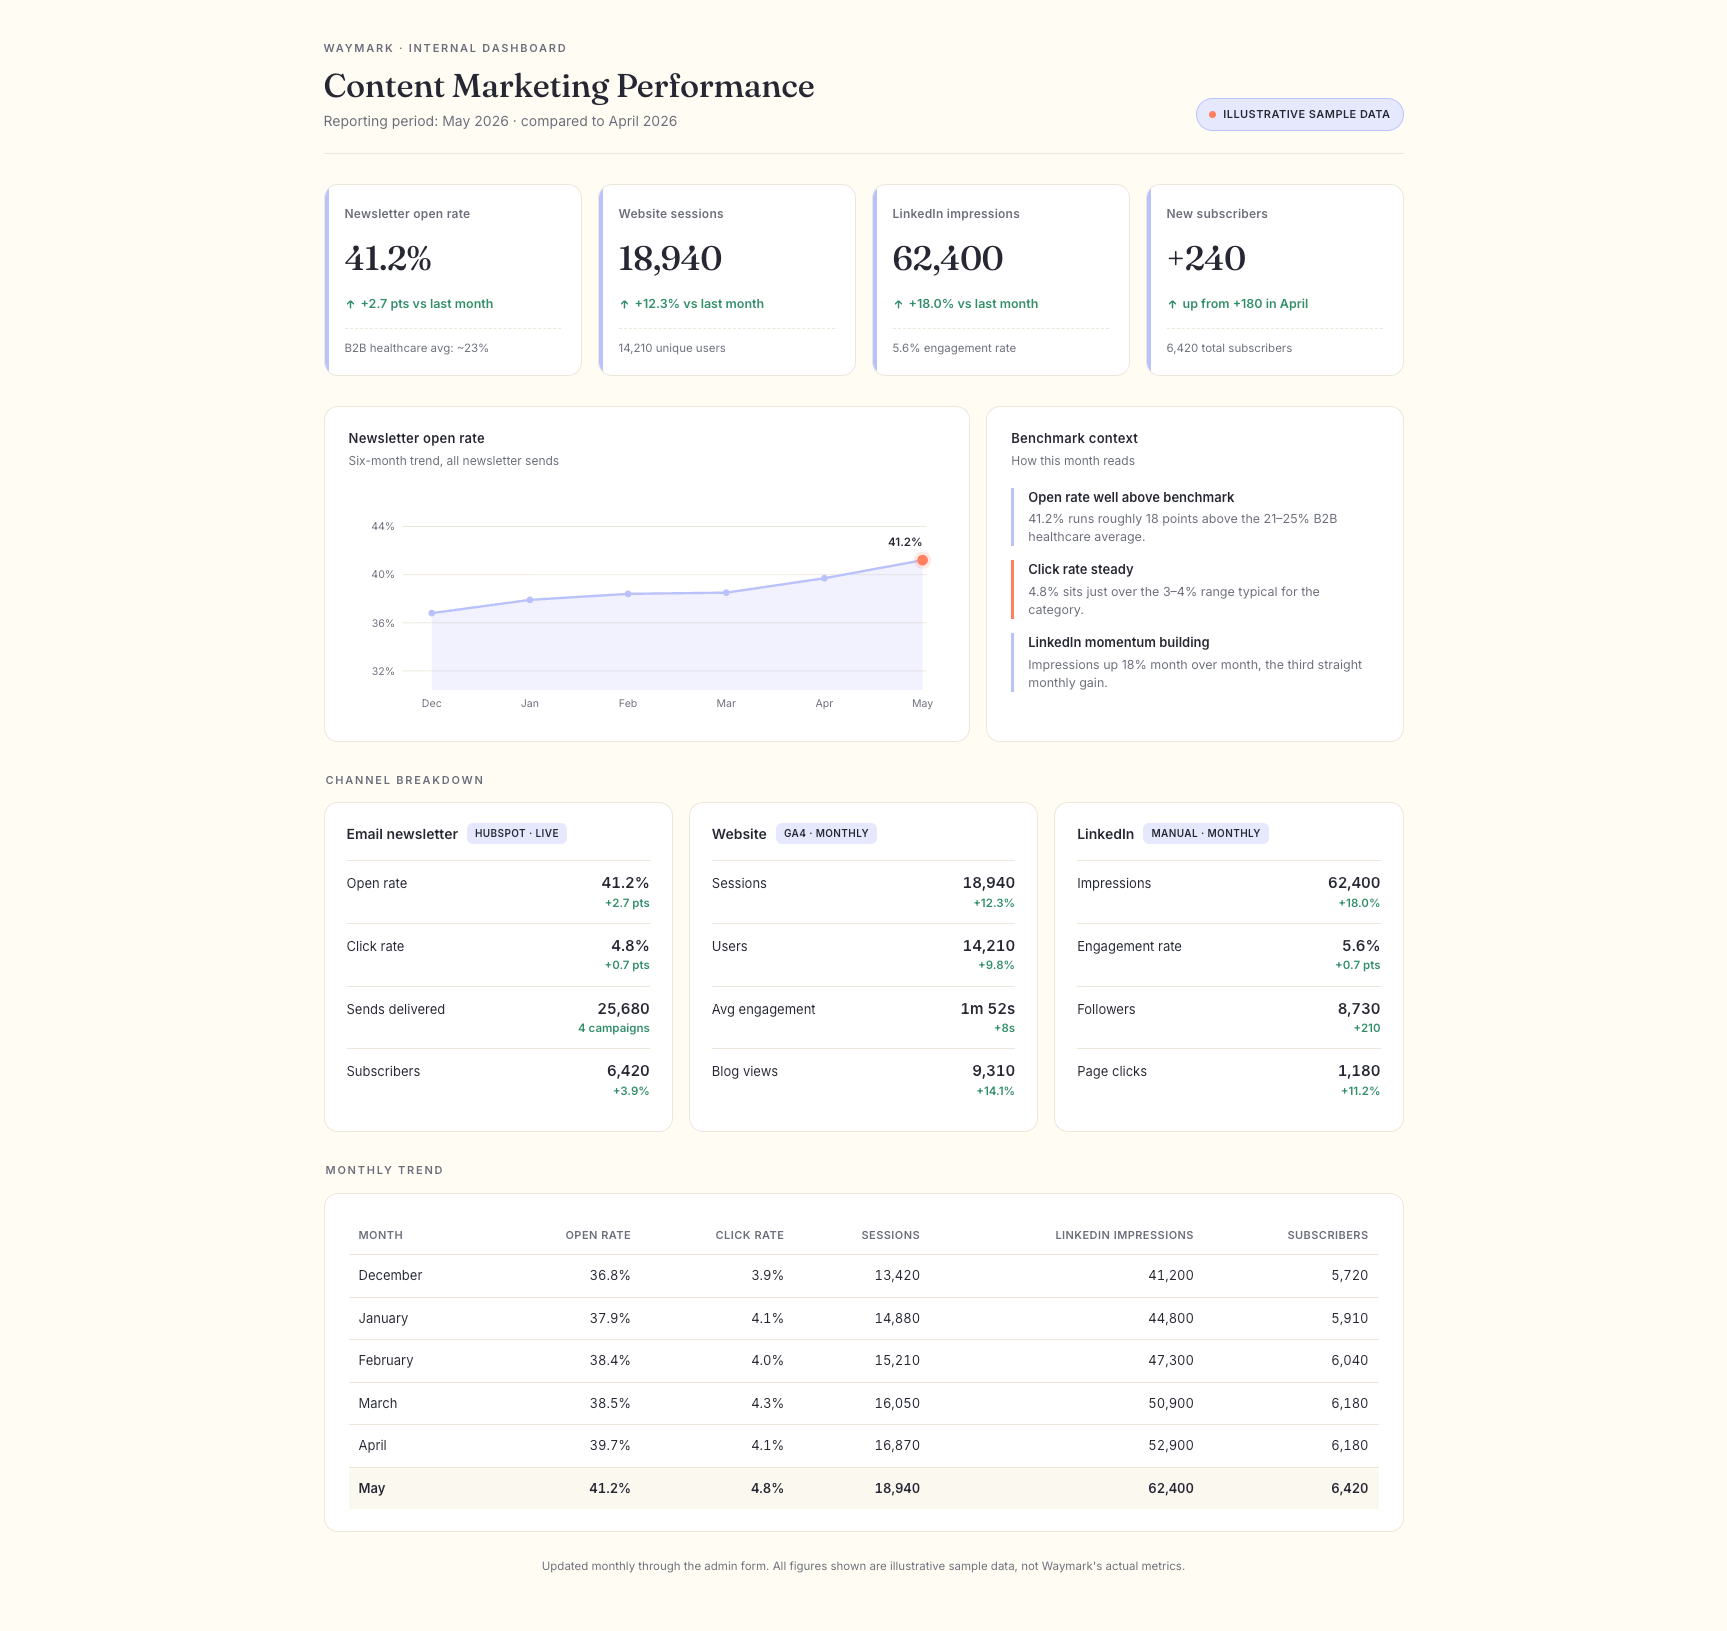
React also gave me full control over the visual design, so I could build the dashboard in Waymark's actual brand instead of Streamlit's default styling. Plus, it let me replace the clumsy monthly data routine, which had meant editing a file and uploading it to GitHub by hand, with a proper password-protected admin page where I enter the month's manual numbers through a simple form. I built the full application – thirteen files in all – and even designed it in Waymark's brand palette. The main dashboard combined live HubSpot email data with input sections for the GA4 and LinkedIn numbers, metric cards showing period-over-period change, benchmark context boxes, and trend tables and charts.
Behind a password, the admin page held the forms for monthly manual entry, with the data stored in a Vercel KV store so it persisted between visits. I deployed it to Vercel and worked through the production setup myself: environment variables for the HubSpot access token and the admin password, and the storage connection for the manual data.
That last step added one more lesson to this whole experience. The storage integration generated its credentials under a default name that the code library did not expect, and the dashboard could not read its own data until I set the variable prefix to match what the library was looking for. It was a great functional reminder that in a real deployment, the last ten percent of wiring things together is often where the time goes.
What I Learned
Knowing when to stop engineering and start working around is a skill. Both LinkedIn and GA4 blocked the clean technical path. The progress came from accepting a manual fallback for one and rebuilding the architecture for the other, instead of forcing connections the permissions and security rules were never going to allow.
Security restrictions are a real design constraint in healthcare – but don’t get upset, because they should be. The policies that blocked my GA4 workaround exist for good reasons. Building around them is part of doing this work responsibly in a regulated environment.
The audience determines the design. Building for non-technical executives meant the hardest decisions were editorial: which metrics to surface, how to label them, what benchmark context to add, how to show change at a glance. No tool makes those calls. They come from understanding who is reading and what they need to know.
AI assistance expands what a non-developer can build without replacing the judgment. Claude helped me write and debug the code and diagnosed the API problems with me in real time. What it could not do was decide what the dashboard was for, who it served, which numbers mattered, or how to frame them for leadership. I owned every one of those decisions.
The Outcome
I shipped a live, private, fully branded content marketing dashboard that pulls newsletter performance directly from HubSpot and presents website and LinkedIn metrics alongside it, with period-over-period movement and benchmark context, in a format built for the people who actually read it. The monthly reporting routine that used to mean logging into three platforms and assembling a document by hand is now a single live view, updated through a simple admin form.
Tools used: Claude (Anthropic) for code, debugging, and live API diagnosis, with decisions and review owned by me; Python and Streamlit for the first build; React, Next.js, and Vercel for the production rebuild; the HubSpot API for live email data; GitHub for version control.